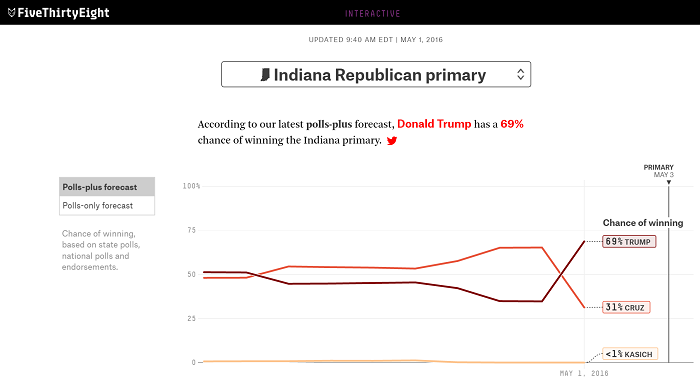
The graph shows it is likely tRump lackeys were whispering iCarly in Cruz's ear as he slept. Ted, that was almost as good an impulsive decision as Walnuts picking the unvetted Caribou Barbie in 2008.
In the animated version I screen-shot that from, there are values on the x-axis and you can see that the data points begin on April 22nd. So Silver & Co have conclusively proven that Trump will probably win 69 of 100 elections held on May 1st. Behold the majesty of data-driven journamalism!
He says if your graph is boring, it isn't because you don't have 3D bars and drop-shadows, but rather because your data are boring. These books changed my life:
Or for that matter, a Republican National Convention?
Adiós Señor Cruz y Signora Fiorina!
So long, Hopeful Johnny, you Croation anchor babby!
Bye Felicia!
Croatoan?
<img src="https://s-media-cache-ak0.pinimg.com/736x/3f/3f/0c/3f3f0caae3f3c30a4545165b9cba206c.jpg"/>
KASICH FOR THE WIN
Hey, he might just surprise ya!
KASICH FOR THE rubio WIN!
OHIO POWER!
The graph shows it is likely tRump lackeys were whispering iCarly in Cruz's ear as he slept. Ted, that was almost as good an impulsive decision as Walnuts picking the unvetted Caribou Barbie in 2008.
Over at "Slate" Newell says desparate moves such as that one will forever be known as "pulling a Cruz."
Look at all those straight and pretty* lines in that graph! I'm thinking that I can count the number of data points with one hand.
*(Yes, yes, BLTΓΘ's can be pretty, too)
Coincidence? I THINK NOT
<img src="https://www.tedcruz.org/wp-content/uploads/downloads/profile/CircleFlame.png"/>
<img src="http://media.guim.co.uk/085d5af5309958b36f643aa62aa678ba59023f4a/0_0_800_800/500.jpg"/>
I just figured Cruz's logo was a bit too stylized to be clear:
<img src="http://www.englishforum.ch/attachments/daily-life/79641d1397035997-protestants-christians-burnt-stake.jpg">
Sure we do–the more footage of TehRump saying something to alienate the voters in the general election, the better!
#nice
In the animated version I screen-shot that from, there are values on the x-axis and you can see that the data points begin on April 22nd. So Silver & Co have conclusively proven that Trump will probably win 69 of 100 elections held on May 1st. Behold the majesty of data-driven journamalism!
You know Tufte, I presume?
If you knew Tufte like I know Tufte….
EdwardTufte.com
He says if your graph is boring, it isn't because you don't have 3D bars and drop-shadows, but rather because your data are boring. These books changed my life:
http://smile.amazon.com/s?ie=UTF8&page=1&…
<img src="http://yuriweb.com/images/tufte-powerpoint.jpg" />